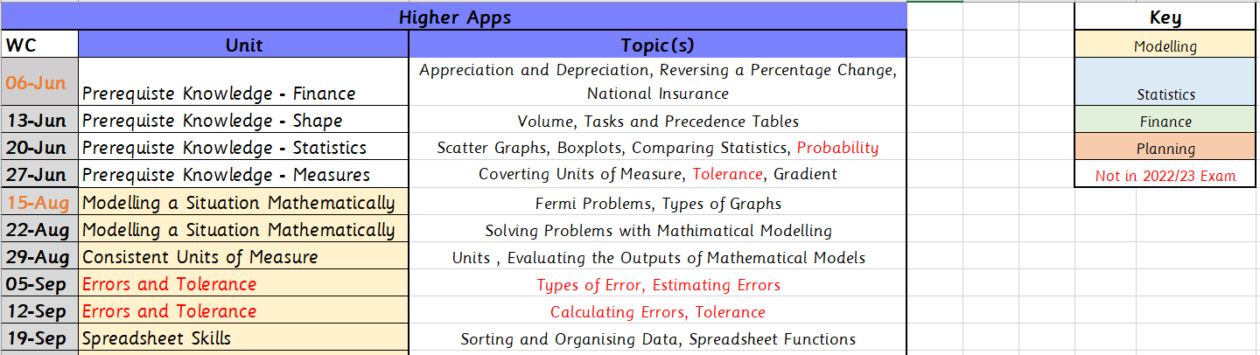
You can download my original scheme of work for the Higher Apps course here: Scheme of Learning.
You can read the rationale behind this scheme of work here: Scheme of Learning (2022).
Higher Apps Data Sets
Here’s a collection of datasets perfect for running the following tests:
t-tests (paired and unpaired)
z-test for two proportions
Correlation test
All are in the csv format, and can be imported into R Studio with minimal fuss.
The data are randomly generated. These datasets are designed to be used for examples, and getting simple practice done. Once you’ve mastered the basics, be sure to source some real datasets.
## Fermi Problems
Fermi problems are named after Enrico Fermi. They are ‘back of the envelope’ calculations, based on sensible estimates.
#### Tasks/Ideas
- Leckie Higher Applications Student Book – **Chapter 1 – Exercise 1A**
- To hear a bit of Fermi working out in action, listen to the following clip for the BBC’s More or Less. The Fermi bit starts around 7 minutes, 22 seconds. [Has the number of periods a woman has in her lifetime quadrupled?](https://www.bbc.co.uk/sounds/play/w3ct2dkk "Has the number of periods a woman has in her lifetime quadrupled?")
- The University of Bristol has a [wonderful series](https://www.stem.org.uk/resources/collection/419670/fermi-problems) of Fermi problems. To download the booklet you must register for a free account.
#### Worked Example
A food manufacturer produces 500 litres of soup per hour. The soup is sold in steel cans with a cylindrical shape.
The soup cans have a diameter of 6.5cm and a height of 9.8cm. The manufacturer must buy steel in sheets of 1m by 1m in order to produce the cans.
1. Estimate the amount of soup produced in a month. State any assumptions you make.
2. Estimate the number of sheets, to the nearest 1000, that the soup manufacturer must buy per month. State any assumptions you make.
See a video going through this example, here: [Applying Maths on Youtube](https://youtu.be/J9NnKTo1d24).
## Type of Graphs
In Higher Apps, there are three main types of graphs that we will use for mathematical models.
- [Linear](https://www.desmos.com/calculator/gjbloclehf)
- [Quadratic](https://www.desmos.com/calculator/pfdwlq5qht)
- [Exponential](https://www.desmos.com/calculator/q2akbfqxkb)
Click the links to interact with the graph types.
#### Tasks/Ideas
- Leckie Higher Applications Student Book – **Chapter 1 – Exercise 1B**
- [Shell Centre – Language of Functions and Graphs](https://www.mathshell.com/materials.php?item=lfg&series=tss) – This book can be downloaded for free (Teacher’s Guide and Photocopy Masters) and is a great source of questions. For example:

- [St. Matthew Island](https://en.wikipedia.org/wiki/St._Matthew_Island) – An example of how population changes over time.
- [Google Trends](https://trends.google.com/trends/?geo=GB) – A good source of graphs about the popularity of different seach terms. For example:

## Fitting a Model and Solving Problems
Consider the following graph:

1. What could the x and y axes represent? Try to think of lots of different ideas.
2. What should a line of best fit look like for this graph? Would it be a straight line, or would it be a curve? Think about your answers to question 1, does your answer change depending on the variable?
#### Tasks/Ideas
- Leckie Higher Applications Student Book – **Chapter 1 – Exercise 1C**
- [Shell Centre – Language of Functions and Graphs](https://www.mathshell.com/materials.php?item=lfg&series=tss) – The exam questions at the start of the booklet are useful here.
- An excellent collect of modelling problems can be found here: [https://www.cimt.org.uk/projects/mepres/core-maths/P1/index.htm](https://www.cimt.org.uk/projects/mepres/core-maths/P1/index.htm)
# Consistent Units of Measure
One way to check whether a model is valid is to consider whether it’s units are valid. Consider speed, which a distance divided by a time. The units are speed are something like “miles per hour”, “metres per second”, in other words, a distance over time.
An invalid model might not have consistent units. If I write A = B x C, where A is a speed (m/s), B is a distance (m) and C is a volume (cubic metres), this model can not be correct.
#### Tasks/Ideas
- Leckie Higher Applications Student Book, **Chapter 2 Exercises 2A and 2B**.
- Does it have consistent units? – [Bryn Jones](/assets/downloads/Consistent-Units.docx) – This resource asks students to consider a series of formulae and work out whether each formula could model area.
- A good source of discussion can be looking at formulae from Physics. For example, this website lists several: [Cyber Physiscs](https://www.cyberphysics.co.uk/general_pages/equations.html). If you know the units that most of the variables are measured in, can you work out the units of the variable you don’t know?
- A fantastic video showing the power of units and mathematical modelling: [Numberphile](https://www.youtube.com/watch?v=SUnAvL-ThMs)
- A slightly silly, but mathematically interesting example of mathematical modelling and unit cancelation. The brilliant [What If?](https://what-if.xkcd.com/11/) from Randall Munroe (XKCD) perfectly demonstrates what can be done with consistent units.
# Error & Tolerance
Students need to be able to calculate and estimate errors. Students will need to be familiar with the terms “relative” and “absolute” error.
#### Tasks/Ideas
- Leckie Higher Applications Student Book – **Chapter 3**
- My [Higher Apps Task Booklet](/assets/pdfs/Higher_Apps_Task_Booklet.pdf) has a whole special on errors- see task 4.
- Here is a lesson PowerPoint for Error and Tolerance:
[Error and Tolerance Slideshow](/assets/downloads/Error-and-Tolerance-Sharing-1.pptx)
## Spreadsheet Functions in Higher Apps
The following Excel functions are used at Higher Apps:
- SUM
- PRODUCT
- IF
- AND
- OR
- ROUND
- ABS
- INT
- AVERAGE
- MIN
- MAX
- MEDIAN
- COUNTIF
- STDEV.S
- PEARSON
You also need to know how to perform a Goal Seek, sort data, and produce diagrams.
#### Tasks/Ideas
- Leckie Higher Applications Student Book – **Chapter 4 – Exercises A & B**
- Bruce Gray has put together a great task on using spreadsheets, inspired by the 2025 paper question Q12. [Download on TES.](https://www.tes.com/teaching-resource/-13338820?fbclid=IwdGRjcANU3fFjbGNrA1Td42V4dG4DYWVtAjExAAEeHRsraqRIQ6MQ_aeASpXz91_4OqXvjeuVZw_JJK0q18yU5KOR4qBEeBcL-Gw_aem_BCg9jBrukd3qL8AxBEhBjg)
- A lot can be learnt by playing around in a blank Excel file. Consider asking students to answer the following questions:
1. Find the sum of the first 100 integers.
2. Find the product of the first 30 odd numbers.
3. Create a spreadsheet with the names and ages of everybody in your class. Add a column named “Can Apply For a Drivers’ Licence” and use the IF function to say whether they can or can’t. Use the COUNTIF function to work out how many people in the class can apply for a licence.
- Have students download the [Starbucks Menu Information Spreadsheet](/assets/downloads/starbucks-menu-nutrition-food.csv). (Thanks to [Kaggle](https://www.kaggle.com/datasets/starbucks/starbucks-menu?select=starbucks-menu-nutrition-drinks.csv)). Students can answer any questions that occur to them. Some examples:
- What is the average amount of Fat?
- How many items have less than 300 calories?
- What’s the standard deviation for Fiber?
- Is there a correlation between Fat and Protein?
- What is the range of Calories? (There is no range function- how could MAX and MIN help here?)
- Produce a Scatterplot and/or a Boxplot.
- How many items have fewer than 320 calories AND more than 5g fibre?
- How many items have more than 300 calories OR more than 70g of Carbs?
- To understand PEARSON, have students plot a scatterplot and comment on the correlation (if any). Then have them use the PEARSON function. I recommend using the [Bee Aware task](https://donsteward.blogspot.com/2013/12/bee-aware.html), from the late, great Don Steward. ([PDF version here](/assets/downloads/9-DS-Bee-Aware-task.pdf))
## Recurrence Relations
#### Tasks/Ideas
- Leckie Higher Applications Student Book – **Chapter 4 – Exercise C**
- Here’s a worksheet I’ve made of questions to help students practice this important skill: [Recurrence Relations](/assets/downloads/Recurrence-Relations.pdf).
Statistics
# Venn and Tree Diagrams
## Venn Diagrams
Venn diagrams are much loved in popular culture- almost every student will have seen one in the wild.

Set notation isn't needed for Higher Apps. It's likely students will need to fill in a Venn diagram featuring three sets.
#### Tasks/Ideas
- Leckie Higher Applications Student Book – **Chapter 5 – Exercise B**
- Gaming survey: Venn Diagram [worksheet](/assets/downloads/Venn-Diagram-Gaming-Task.pdf).
## Tree Diagrams
#### Tasks/Ideas
- Leckie Higher Applications Student Book – **Chapter 5 – Exercise A**
- Dr Austin has loads of Tree Diagram material [here](https://www.draustinmaths.com/combined-events).
# Sourcing data
## Gathering Data
Students need to know about different types of data, as well what a sample and a population are.
#### Tasks/Ideas
- Leckie Higher Applications Student Book – **Chapter 6 – Exercise 6A**
- Types of Data Worksheet- [Download Here](/assets/downloads/Types-of-Data.docx)
- Populations and Samples- [Mrs Cao’s Classroom](https://kttmc.weebly.com/uploads/2/1/2/7/21275598/10.6a_samples_and_populations_hw__18.19_.pdf)
- A great activity is to have students search online for a dataset that interests them. Answer the following:
1. Have them look at each column- what are the data types?
2. Is the dataset a sample, if so what was the population?
3. If this was a sample, was it a random sample? How do you know?
## Bias
#### Tasks/Ideas
- Leckie Higher Applications Student Book – **Chapter 6 – Exercise 6B**
- [This worksheet](https://www.tesd.net/cms/lib/PA01001259/Centricity/Domain/485/Misleading%20and%20graphing%20practice%20with%20key.pdf) has lots of different scenarios to consider, with answers too!
## Outliers
#### Tasks/Ideas
- Leckie Higher Applications Student Book – **Chapter 6 – Exercise 6C**
- How does removing outliers affect different statistics? – [Outliers – Applying Maths](/assets/downloads/outliers.pdf)
## Sourcing Data for the Project
#### Tasks/Ideas
- Leckie Higher Applications Student Book – **Chapter 6 – Project Box**
- Here are some useful places for students to look for data:
- [Open Intro](https://www.openintro.org/data/) – Lots of data on lots of topics, all available in a CSV format. Most importantly for students doing their projects, it describes where the data comes from. I couldn’t recommend this website more!
- [CORGI Data Sets](https://corgis-edu.github.io/corgis/csv/) – The **C**ollection **o**f **R**eally **G**reat, **I**nteresting, Situated Datasets. Nothing to do with dogs, just lots of students-friendly datasets to use and explore.
- A good piece of advice is to search for datasets using the terms “csv” and “beginner” in the search terms. Another piece of advice- if the dataset looks like a mess, it’s not clear whether it’s a sample or a population, and you can’t find any information about where the dataset came from- leave it be and keep searching!
Remember, it makes no sense to complete a hypothesis test on a population. You can only complete a hypothesis test on a sample. As the project requires a hypothesis test to be completed, the dataset **must be a sample**. Never lose sight of this!
# Forming a subjective impression
## R Studio and Producing Diagrams
Students will need to be confident importing data into R Studio, and producing different diagrams. The Leckie Student Book has a list of all the R Code you need, and you can find R Code in the [Data Booklet](https://www.sqa.org.uk/sqa/files_ccc/h-applications-mathematics-r-code.pdf) too.
#### Tasks/Ideas
- Leckie Higher Applications Student Book – **Chapter 7 – Exercise 7A**
- A fantastic introduction to R Studio is the ‘Cow to Cone’ resource from the SRUC and Education Scotland. [You’ll find it here](https://glowscotland.sharepoint.com/sites/mathsplc/SitePages/NQ%20Resources%20Applications.aspx) (Glow login required). The R code is more advanced than you’ll need, but it’s a rich (and real!) dataset and is well explained.
- Once students have got the hang of importing data, nothing will beat just giving them a dataset and getting them to explore. Below are 3 datasets that are good for importing and generating tables or diagrams:
- [UK Smoking Data](https://www.openintro.org/data/index.php?data=smoking) – e.g. produce a two-way table showing gender and whether the person smokes, produce a pie-chart showing the breakdown of the different regions sampled.
- [Exam grades](https://www.openintro.org/data/index.php?data=exam_grades) – e.g. produce boxplots showing the results of the different exams and compare them.
- [Classic books](https://corgis-edu.github.io/corgis/csv/classics/) – e.g. produce a scatterplot showing Downloads on Publication Year.
## Normality and Measures of Spread and Central location
At Higher Apps students can use a histogram to interpret whether data are normally distributed or skewed. Based on this, students will need to either find the median and inter-quartile range, or find the mean and standard deviation.
#### Tasks/Ideas
- Leckie Higher Applications Student Book – **Chapter 7 – Exercise 7B**
- Applying Maths – [Normal or Skewed](/assets/downloads/Normal-or-Skewed.pptx) – Interactive Powepoint
- An online quiz covering normal and skewed data: [siyavula.com](https://www.siyavula.com/read/maths/grade-11/statistics/11-statistics-05)
- A worksheet by me on which average should be use – [Which Average](/assets/downloads/2023-10-08-Which-Average-2-1.pdf)
- If you need to create your own normal data, use this code in Excel: =NORMINV(RAND(), [Mean], [Standard Deviation]). Replace [Mean] and [Standard Deviation] with the numbers you want for them, and then drag down. You can do this in R too using this function: x <- rnorm([Amount of Numbers], mean=[mean], sd=[sd]).
- This [Skew The Script](https://skewthescript.org/1-4) lesson explores skewed data and choosing the correct average.
# Hypothesis tests confidence intervals errors
## Hypotheses and Errors
Students need to be able to state the null and alternative hypotheses for the tests, and be aware of Type I and Type II errors.
#### Tasks/Ideas
- Leckie Higher Applications Student Book – **Chapter 8 – Exercise 8A**
- A worksheet on Type I and Type II errors is here: [Type I and Type II Errors](/assets/downloads/Type-I-and-Type-II-Errors-1.pdf). Answers, and original version [here](https://cdn5-ss18.sharpschool.com/UserFiles/Servers/Server_589998/File/Levenseller%20Files/AP%20Statistics/Type%20I%20and%20Type%20II%20Error%20WS%20Key.pdf).
## Confidence Intervals
#### Tasks/Ideas
- Leckie Higher Applications Student Book – **Chapter 8 – Exercise 8B**
- The best way to understand confidence intervals is to use this webpage by Bruce Dudek: [https://shiny.rit.albany.edu/stat/confidence/](https://shiny.rit.albany.edu/stat/confidence/). It’s so essential the SQA link to this page in the course specification!
## Confounding Variables
XKCD:
[](https://xkcd.com/552/)
#### Tasks/Ideas
- Leckie Higher Applications Student Book – **Chapter 8 – Exercise 8C**
- This website lists many examples of spurious correlations: [Spurious Correlations](https://www.tylervigen.com/spurious-correlations)
- A PowerPoint that gives a gentle introduction to the idea: [Ceviche on TES](https://www.tes.com/teaching-resource/correlation-and-cause-6047774)
# Performing hypothesis tests
## Correlation Tests
#### Tasks/Ideas
- Leckie Higher Applications Student Book – **Chapter 9 – Exercise 9A**
- This [N Rich activity](https://nrich.maths.org/7360) can be used for exploring correlation, there is a dataset to download.
- Have students import the following [fishy dataset](https://www.kaggle.com/datasets/aungpyaeap/fish-market) into R, and investigate if there is a linear regression between different variables. You need a free Kaggle account for this.
- [Life expectancy data](https://www.kaggle.com/datasets/kumarajarshi/life-expectancy-who) from the WHO. (Kaggle)
- This [wine dataset](https://archive.ics.uci.edu/ml/datasets/wine+quality) can be used for linear regression too. It’s little trickier to use, you may have to use the “text to columns” feature on Excel to make the spreadsheets nice.
## T-tests and Paired T-tests
#### Tasks/Ideas
- Leckie Higher Applications Student Book – **Chapter 9 – Exercise 9B**
- This [N Rich activity](https://nrich.maths.org/7360) can also be used for t-tests!
- Using animals in research, wrong or necessary? [This dataset](https://onlinestatbook.com/2/case_studies/animal_research.html) (downloadable at the bottom of the page) looks at the gender difference, and features several questions for students to answer.
- Is there a difference in the weights of babies depending on whether the mother is a smoker? Use [this dataset](https://www.openintro.org/data/index.php?data=births14) to investigate!
## Z-test for Two Proportions
#### Tasks/Ideas
- Leckie Higher Applications Student Book – **Chapter 9 – Exercise 9C**
- Cancer in dogs and exposure to herbicide. [This dataset](https://www.openintro.org/data/index.php?data=cancer_in_dogs) will let students produce tables, barcharts/pie-charts, and perform the hypothesis test.
# Writing higher apps project
## How to Write the Higher Apps Project
The Higher Apps project represents 27% of the final mark for the course. Getting a high score in the coursework will take a lot of pressure of the examination.
## Resources
- Leckie Higher Applications Student Book – **Chapter 10.** The final section of chapters **6, 7 and 9** will help you answer the key questions you need to cover.
- Remember to read the [SQA guidance](https://www.sqa.org.uk/files_ccc/higher-pat-applications-of-mathematics.pdf). Remember: the mark scheme is freely available and students can and should look over it.
- Students **must not** be given a perfect example project to refer to. Students may look at the projects the [SQA have shared](https://www.understandingstandards.org.uk/Subjects/ApplicationsOfMathematics/Higher), which do make mistakes.
- The SQA changed the marking scheme after the first year of the course to tighten up some things. Read about what changed, and how I think you should interpret it, [here](/2022/08/12/sqa-update-project-marking-scheme.html).
- The [Open Intro Datasets](https://www.openintro.org/data/) are a fantastic source of datasets to be used in a project.
## Remember:
- Students lost marks in their introductions and conclusions. Remember to answer these points:
- Introduction: Where did the data come from? This is actually two questions: where did **you** get the data from (is it a reliable source?) and: how did **they** get their data? If you haven’t said how the data was gathered (e.g. a random sample), and mentioned the words “population” and “sample”, something is missing. For example: “I sourced my data from the Scottish government website. As this is a government website it is likely to robust data. The government collected the sample data by randomly surveying 200 households in the Highlands, as they used a random sample the sample should be a good representation of the population (households in the Highlands).” In order to get these marks, students will need to spend time reading about the source of their data.
- Conclusion: In the conclusion everything needs to be referred to again. The charts, the statistics, the hypothesis test result, the question being answered. It **doesn’t matter** that you have talked about these things before, **you must** repeat yourself in the conclusion in aid of answering your question. And again, if you haven’t used the words “population” and “sample” you haven’t answered your question.
Finance
# Financial Products & Inflation
## Financial Products
Students need to know about insurance, credit cards and loans and savings products. Often these will form the context for other questions within the finance part of the course.
#### Tasks/Ideas
- Leckie Higher Applications Student Book – **Chapter 11 – Exercise 11A**
- A PowerPoint lesson all about Insurance: [Insurance Lesson](/assets/downloads/Insurance-Lesson.pptx)
- A useful task that is easy to run is to give students situations, and challenge them to find you the best product on the market. Example questions:
- I have £4000 in savings. I’d like to deposit the money for 5 years. I’d like at least £500 to be easy-access, in case I need to dip into these savings.
- I want to buy a car for £9000, and I’ll need a loan. I have £2500 in savings.
- I’m going on a skiing holiday to Norway. I have no pre-existing medical conditions. I want travel insurance in case I get injured, but I also want to insure my skis.
- Are there any risks I need to consider for each of the above answers?
- Most companies have policy documents available online. e.g. [Direct Line Car Insurance](https://assets.directline.com/motor-docs/policy-booklet-0622.pdf), [Barclay’s Savings Account](https://www.barclays.co.uk/content/dam/documents/wealth-management/site-hygiene/banking-terms/barclays-personal-savings-accounts.pdf), [Santander Loan Document](https://www.santander.co.uk/assets/s3fs-public/documents/personal_loans_kfd_do-ec-192.pdf). What risks are you taking if you purchase one of these products? What risks are these companies taking on by selling them to you? Are any of the policies surprising?
## Inflation
#### Tasks/Ideas
- Leckie Higher Applications Student Book – **Chapter 11 – Exercise 11B**
- [This worksheet](/assets/downloads/Petrol-Prices-1.pdf) looks at petrol prices and inflation.
- You can’t mention inflation without discussing [The Economist’s Big Mac Index](https://www.economist.com/big-mac-index).
- The Bank of England have a useful calculator: [BoE Calculator](https://www.bankofengland.co.uk/monetary-policy/inflation/inflation-calculator).
- Ever wondered what items are in the Customer Price Index’s basket? [Wonder no more!](https://www.ons.gov.uk/economy/inflationandpriceindices/datasets/consumerpriceinflationbasketofgoodsandservices)
- Use these [historical petrol prices](http://www.speedlimit.org.uk/petrolprices.html) and have students work out the effective rate of inflation between two difference years.
# Accumulation and Present Value with a Calculator
## Accumulation and Converting Interest Rates
Students familiar with appreciation and reversing a percentage change should find this topic not too much of a stretch. The basic premise is that you must **multiply** by one plus the interest rate in order to accumulate, and **divide** the one plus the interest rate in order to find the present value.
#### Tasks/Ideas
- Leckie Higher Applications Student Book – **Chapter 12 – Exercise 12A**
- Effective Rate of Interest Worksheet – [Effective Rate Worksheet](/assets/downloads/Effective-Rate-Worksheet.pdf)
## Present Value
#### Tasks/Ideas
- Leckie Higher Applications Student Book – **Chapter 12 – Exercise 12B**
- [Holiday Challenge](/assets/downloads/Holiday-Challenge.pdf) – Present value challenge with multiple payments.
## More Complex Calculations
#### Tasks/Ideas
- Leckie Higher Applications Student Book – **Chapter 12 – Exercise 12C**
# Accumulation and Present Value Using Spreadsheets
## Creating spreadsheets that can be understood
A spreadsheet is well presented if another person could read it and understand what was being worked out. This means clear labelling of columns, a suitable title, and **key** or **base variables.**
A good spreadsheet isn’t just useful for other people- you’ll spot your own mistakes much faster if you lay things out clearly.
Before attempting this topic, make sure your students have mastered the "Spreadsheet Skills" part of the Modelling Topic.
#### Tasks/Ideas
- Leckie Higher Applications Student Book – **Chapter 13 – Exercise 13A**
- Try completing the [Holiday Challenge](/assets/downloads/Holiday-Challenge.pdf) task again, but this time using a spreadsheet. Have students share their spreadsheets with each other; can they follow each other’s spreadsheets?
- Challenge students to create a simple spreadsheet where you can enter an annual interest rate, an initial deposit, a monthly deposit and a number of months to save for. Can the students have the spreadsheet find the total saved? Once you finish the task have the students review each other’s work- how easy were mistakes to find? Was it easy to see the method the students were using? What could they do to make it clearer?
## Accumulation and Present Value
Simple cases can be done on a calculator, but once things start getting complicated a spreadsheet is invaluable.
#### Tasks/Ideas
- Leckie Higher Applications Student Book – **Chapter 13 – Exercise 13B**
- Ask your students what they would like to save for in the future (e.g. deposit for a car, big holiday) and have them make a spreadsheet to see how much they could save. Encourage them to look-up real interest rates for their banks.
- [Zopa](https://www.zopa.com/smart-saver) have an interesting way of doing savings. Show students the different options below (click link for current rates), and have them create a spreadsheet showing how their savings could change over time. What are the risks of choosing a “boosted pot”? What is the risk of using an “Access pot”? What sort of thing would you use an access pot for, what about boosted pots?
[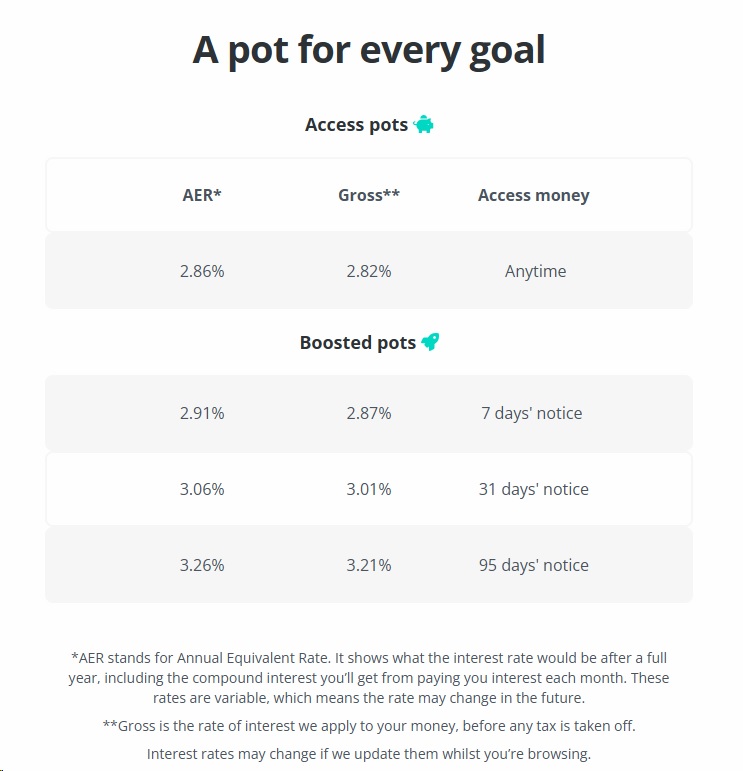](https://www.zopa.com/smart-saver)
- Show students this [savings accumulation spreadsheet](https://www.vertex42.com/Calculators/savings-interest-calculator.html). It has a lot more bells and whistles than anything we’re likely to produce in this course, but ultimately building something like this would be possible for them!
# Salaries taxation financial planning
### Income Tax and National Insurance
#### **Tasks/Ideas**
- Leckie Higher Applications Student Book – **Chapter 15 – Exercise 15B**
- Emily Rae [@ECR_Maths](https://twitter.com/ECR_Maths) has produced a [brilliant document](https://wykecollege-my.sharepoint.com/:w:/g/personal/emily_rae_wyke_ac_uk/EaQb7Fsl2-9IitfohQU2atUBjSFiOwkMQB16IK6jy-yAuw?rtime=AEzWu2XC20g) showing a list of jobs, and the UK average salary. Give this to students and have them calculate the deductions for jobs that interest them.
- To get quick answers to any questions, use this calculator from [Which?](https://www.which.co.uk/money/tax/income-tax/tax-rates-and-allowances/income-tax-calculator-202223-aNIhq2U0bUxs) This is the best online tool as it gives you income tax, NI, gross pay and monthly net pay all in one easy to use form.
Planning
# PERT charts Gantt charts
Here are some [blank Gantt grids](/assets/downloads/blank-gantt-grids.docx).
I've created an [Interactive Gantt Maker](/gantt-maker).
Explore past paper questions as well as other random projects. Read more about this tool in my [blog post](https://applyingmaths.com/2025/09/12/interactive-gantt-charts)
#### Tasks/Ideas
- Leckie Higher Applications Student Book – **Chapter 16 – Exercise B & C**
- An easy source of practice questions are old National 5 Apps questions- simply remake as a PERT or Gantt chart. [Past Paper Questions](https://www.dynamicmaths.co.uk/QuestionBank/get_questions_handler.php?levelQ=5&otherlevellist=13%2C12%2C4%2C9%2C8%2C10&how=A&topics%5B%5D=93&orderR=dateA&calc=CN&noQ=500&minmarks=0&maxmarks=999&NR=RN&interleaved=NA&MC=MCA).
# Risk expected value
#### Tasks/Ideas
- Leckie Higher Applications Student Book – **Chapter 17 – Exercise A**