Interactive Gantt Charts
I’ve created a tool that lets you make interactive Gantt charts - you can find it here.
I created this tool because I felt one of the hardest questions on the 2025 Higher Apps paper was this one:
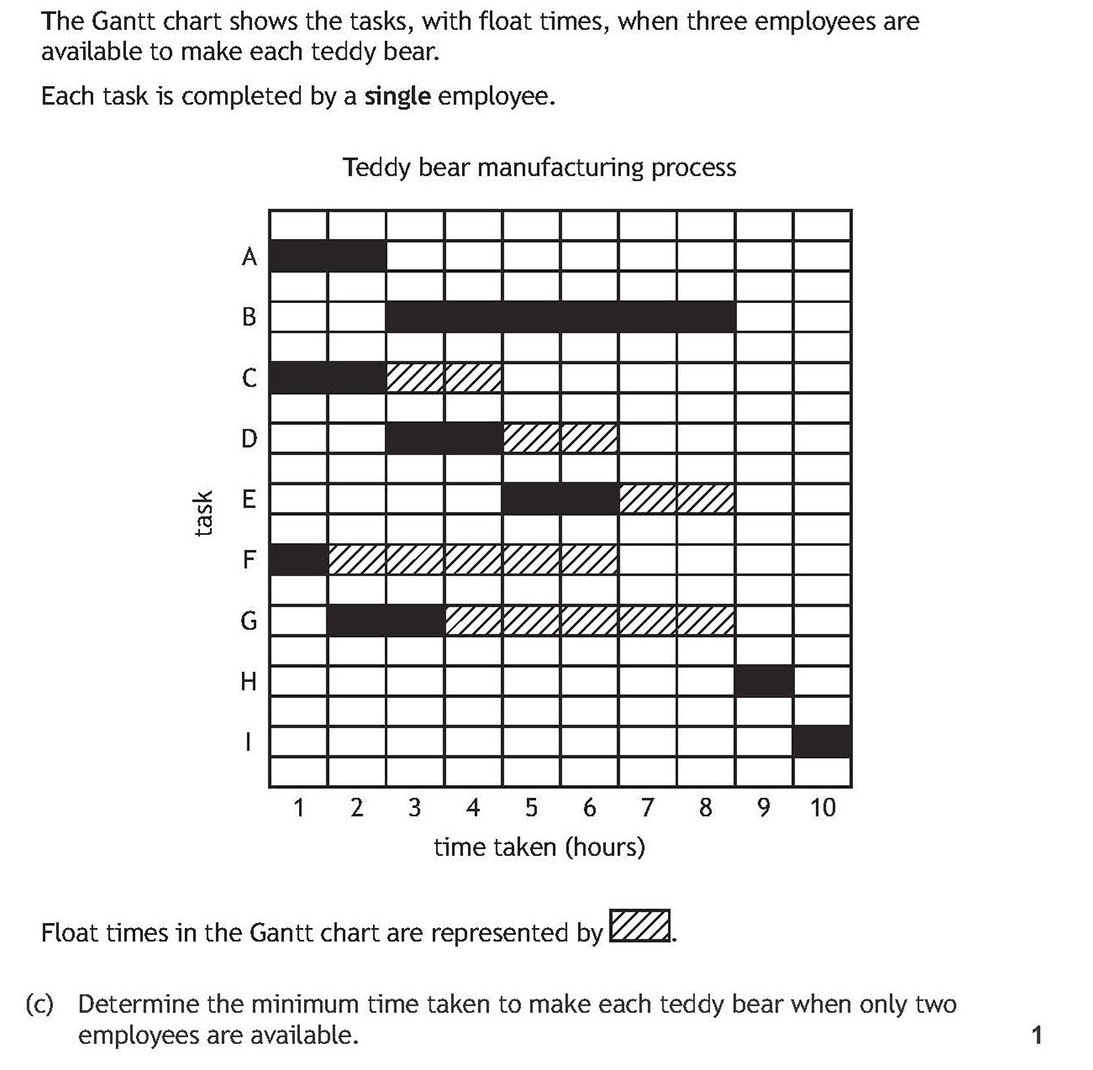
I think if you can visualise sliding the tasks within the float times, you can see that there’s only one hour where all three employees are needed simultaneously.
A demonstration:
The Gantt chart has past paper questions pre-programmed, as well as a bank of random projects. Suggested teaching approach:
- Display the precedence table to the class.
- Have students produce a Gantt chart - these blank Gantt grids might be useful.
- Throw in your own questions - “What happens if activity D is delayed by an hour?”, “How quickly can the project be completed if there are only 2 employees working in it?”, “State the critical path.”
You can also edit the activities and make your own questions. Have fun!
If you find the tool useful, let me know!